The Performance of DFA’s Small Value Fund, DFSVX (and the Story of Rex and Dave)

The year was 1992, but Rex Sinquefield and David Booth, founders of mutual fund company DFA, were feeling trapped in the ‘80s. Rex was still wearing parachute pants and neon ties, and David drove a Pontiac Fiero and had White Snake and Mötley Crüe posters taped to his office walls.

Worse (depending on your opinion of White Snake), their flagship small cap fund had consistently underperformed the stock market through the 1980s.

“Hey man,” said Rex, handing David a Betamax tape with a pirated copy of Top Gun, “we’ve got to reinvent ourselves. Move forward.”

“Thanks for the tape” David replied, “One step ahead of you. Take a look at this.”

And with that he handed Rex a study that changed everything at DFA. It was a research paper called “The Cross‐Section of Expected Stock Returns”, and it was written by academics Eugene Fama and Ken French. The paper showed that differences in size and book value explained most of the variation in equity returns. The smaller the company, and the more book value it had, the better it seemed to perform.

Stocks with a relatively high book value became known as “value” stocks, and those with low book value became known as “growth” stocks.

Notably, the study showed that almost all the returns from the small cap stocks DFA was selling came from the group with a high book value. In fact, small growth stocks had, according to the Fama/French data, 0% returns over the past seven decades! Fama and French speculated that the excess returns of small and value stocks came from excess risk, though they couldn’t identify how.

DFA stands for “Dimensional Fund Advisors”, but DFA had only one stock “dimension” between its founding in 1981 and 1992 – company size. See my last post for details. The Fama/French paper showed how adding a second filter, for value stocks, might improve returns.

In 1993, DFA launched its small value fund, DFSVX, which owned only those stocks that Fama/French data said would produce fantastic returns – far more than the mere 5% per year bonus Sinquefield had claimed for small caps. DFA launched a number of value funds in the early ’90s: small value, large value and international value (large and small).

DFA stock funds were now two dimensional, and a new era had dawned. Rex discovered Pearl Jam and got rid of his earring. David amassed an amazing collection of Beanie Babies, though he never got Tigs the giraffe, which rumor has it he’s still hunting for on ebay.

Where were we? DFA likes to keep the academics whose research it follows comfortably on the payroll – you’d hate to have your marketing strategy upended by some unaffiliated professor who’d changed his mind or revised his data. And in fact, Eugene Fama, co-author of the study, had been on the DFA payroll for years as a part-time trader.

In co-opting their research into a marketing campaign, however, DFA took this to a new level, making Fama and French equity partners in the firm, and, over time, very rich.

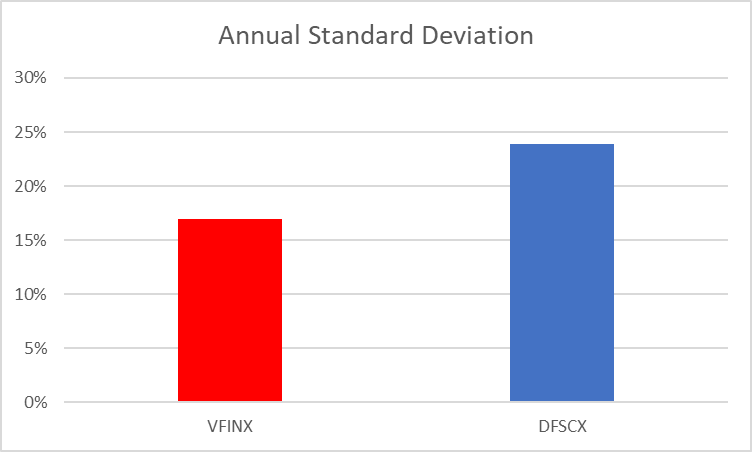
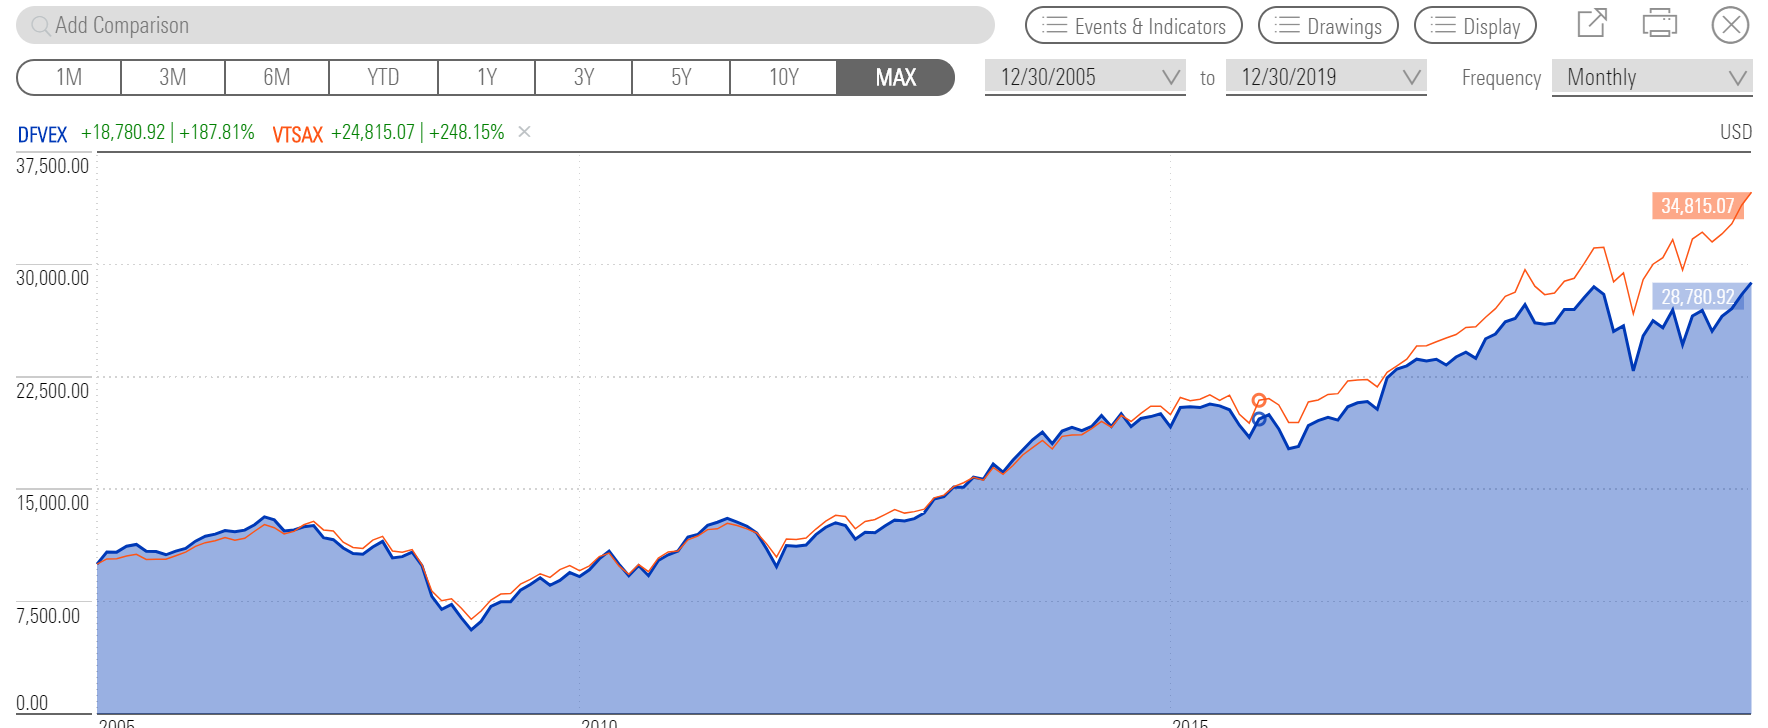
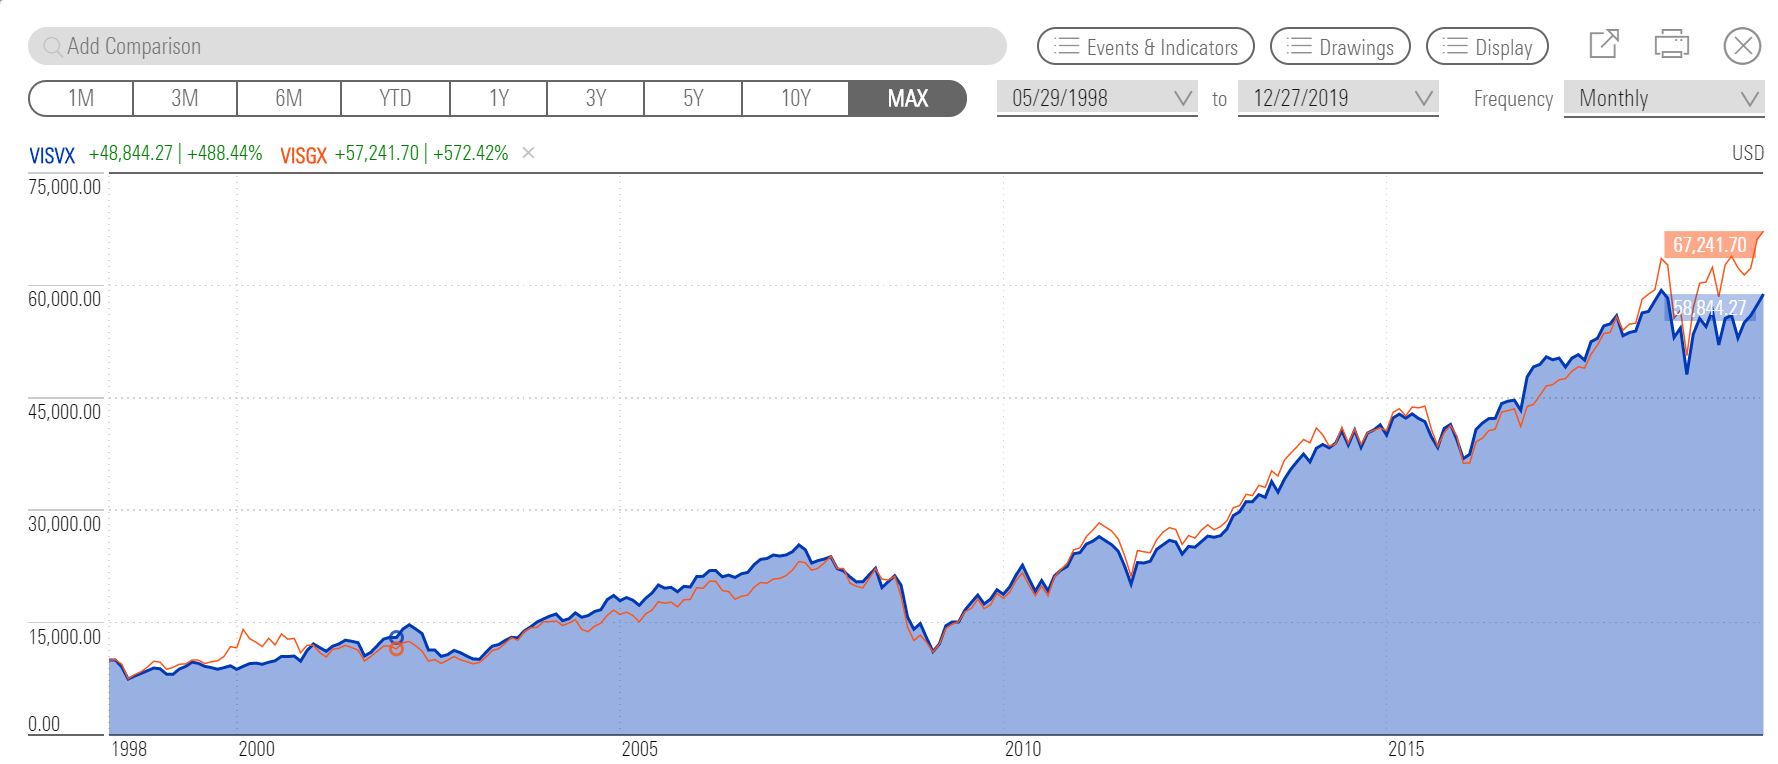
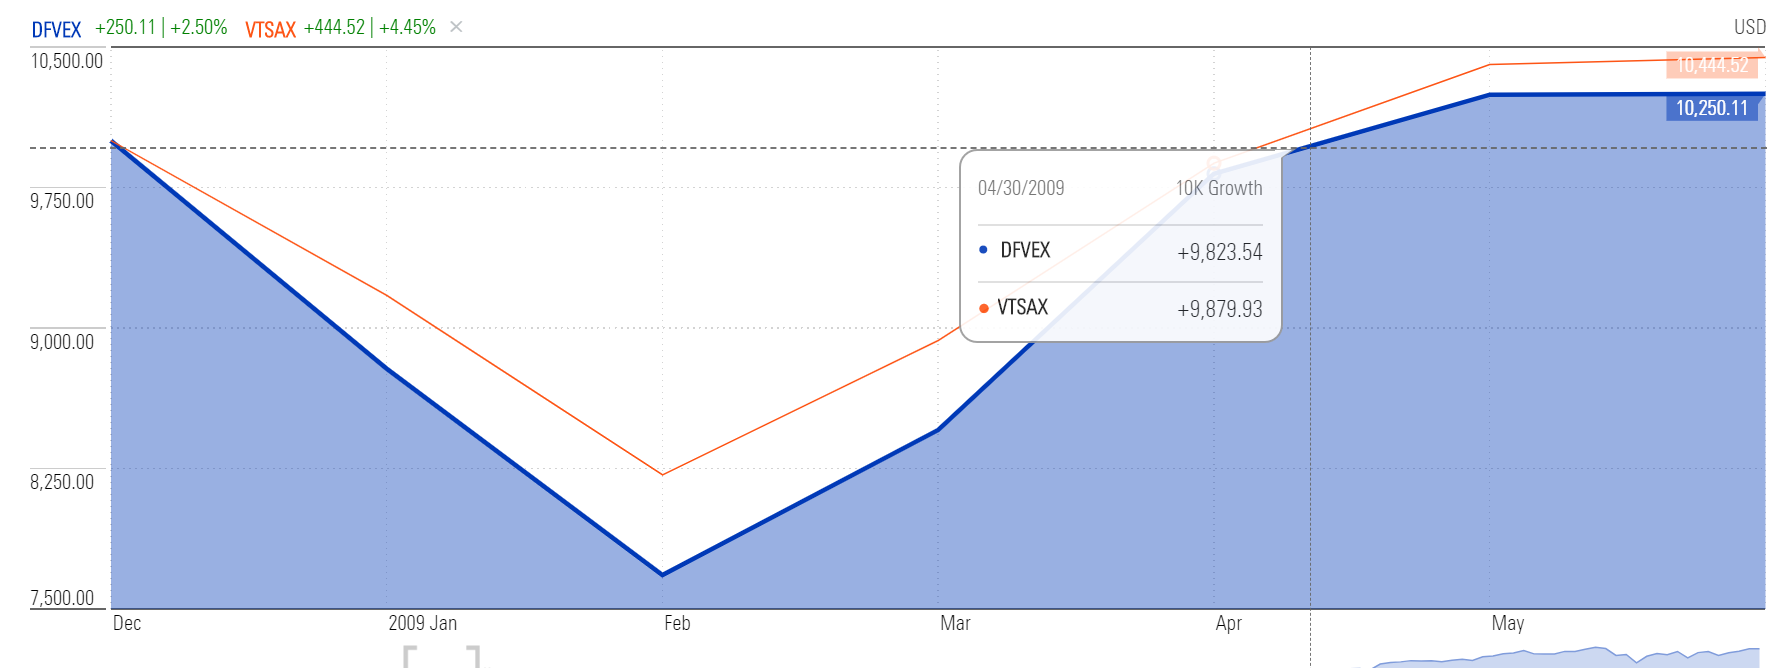
We now have over 27 years of data to judge whether the incredible returns promised by Fama and French materialized for investors. First though, let’s look at risk. We’ll compare DFSVX to the Vanguard Total Stock Market Index fund (VTSAX). All data here from Morningstar:

As with the DFA Small Cap fund, the DFA small value fund exhibits large amounts of volatility versus the market as a whole. If you like wild swings in your portfolio value, DFSVX is for you.

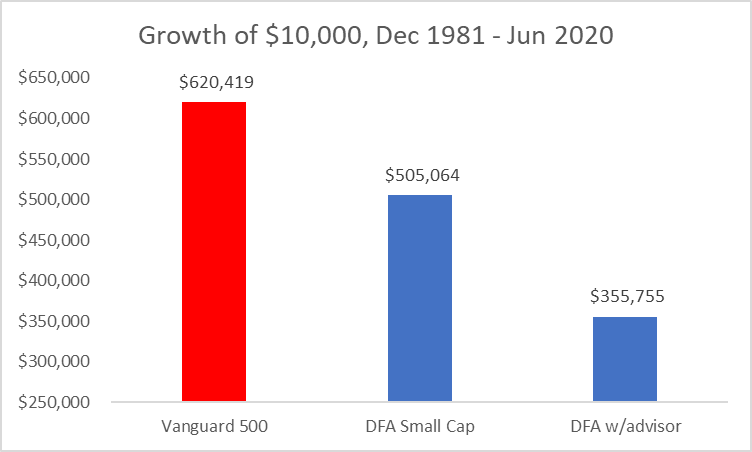
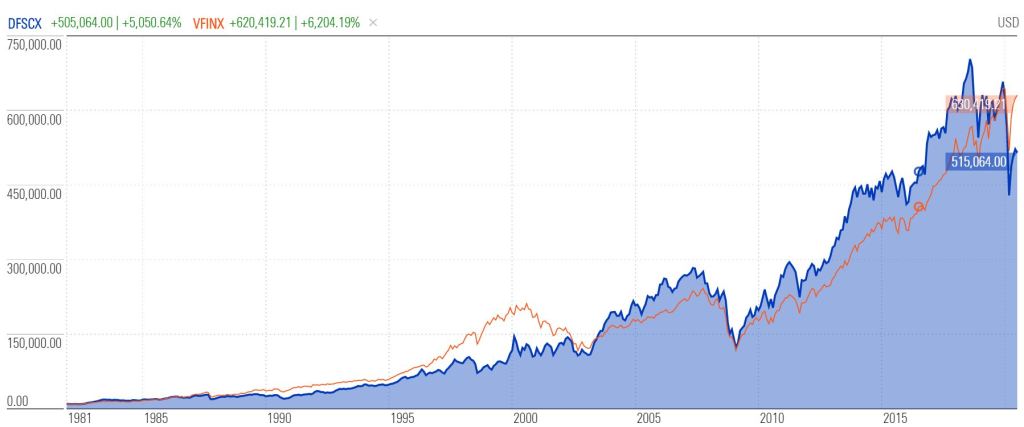
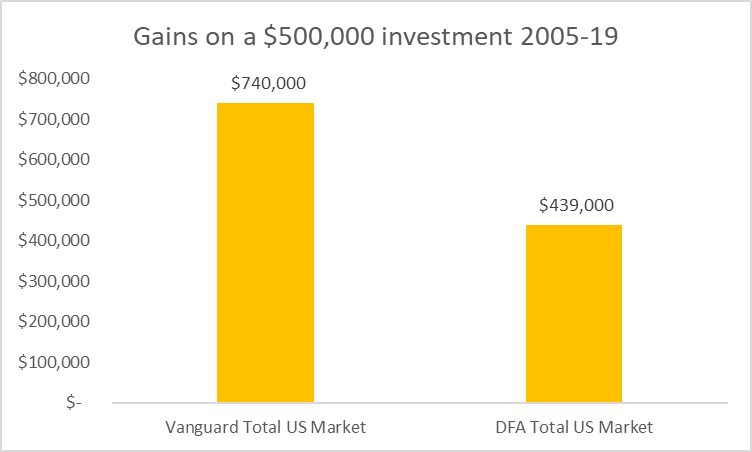
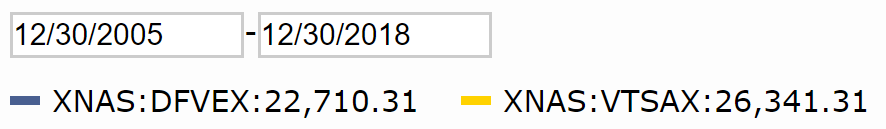
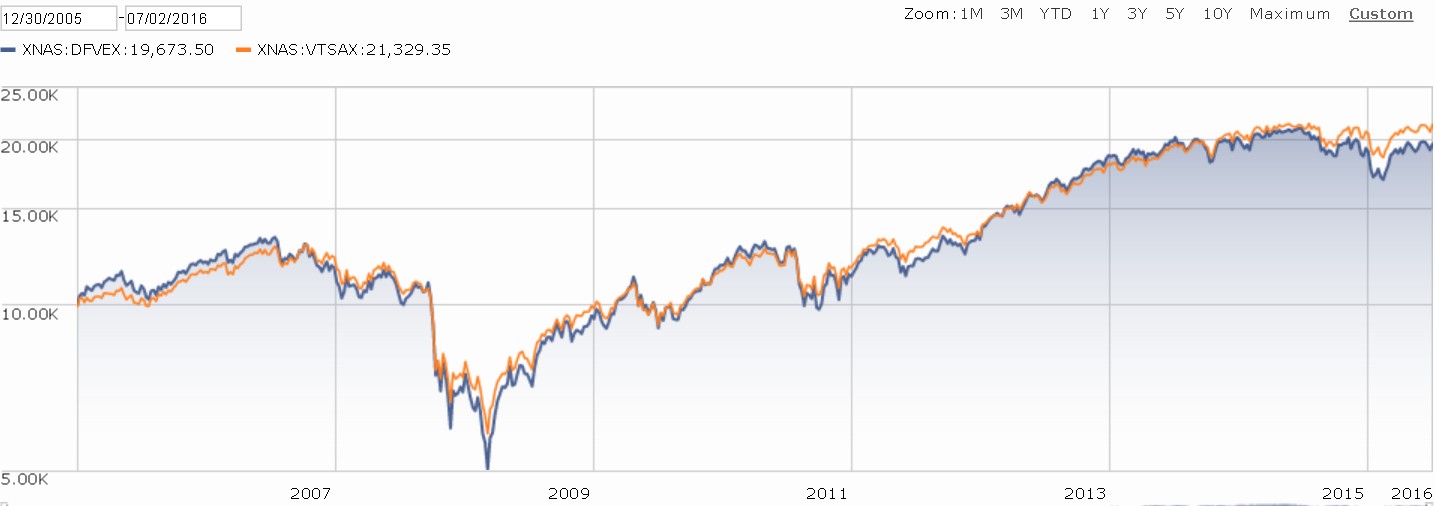
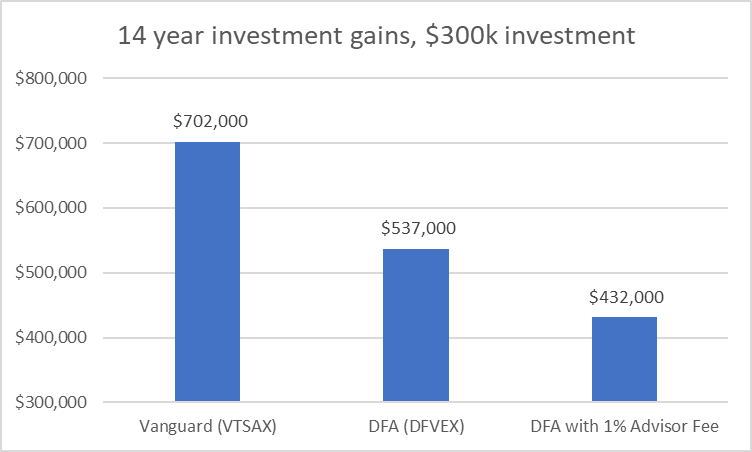
Did investors get the amazing market beating returns promised, or at least strongly implied, by DFA? As always, I also show returns for the DFA fund including a 1% advisor fee, since paying an advisor is the only way to access their funds. The chart below shows the growth of a $10,000 investment in both the DFA and Vanguard funds on the day the DFA fund began trading in 1993 through today:

This one’s a tie – the DFSVX and VTSAX have had the same 9.5% average annual return. Stunningly, investors didn’t get even a penny of the amazing excess profits promised by the Fama/French data. In fact, they came out far behind Vanguard due to the advisor fee layer.

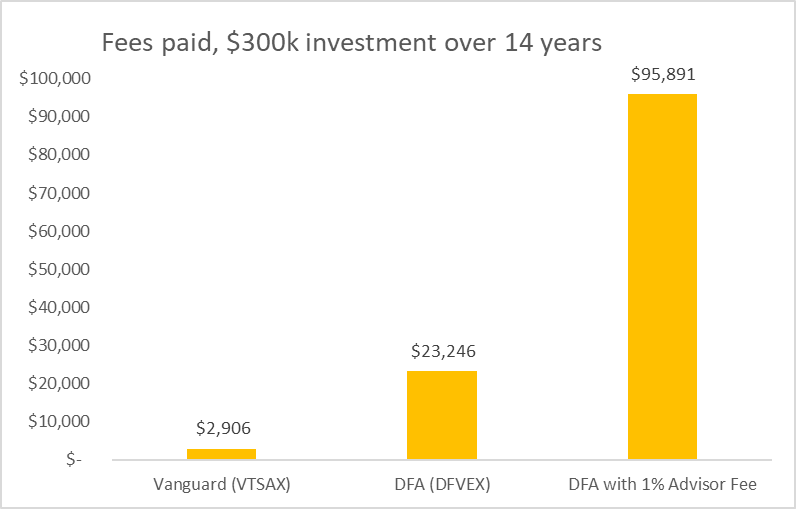
What happened here? For that, I’ll refer you to my last post about the DFA flagship fund, DFSCX, as the problems are the same. The first is cost – even without the advisor fee, the expense ratio of this fund is .5% higher than Vanguard’s.

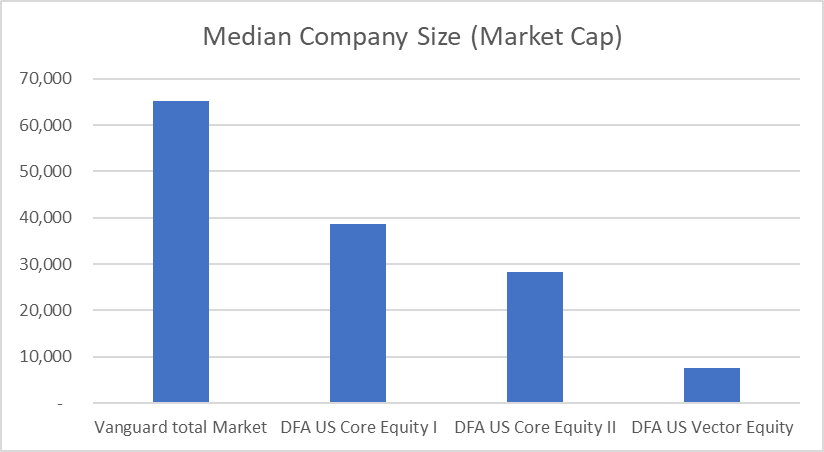
The second is that academic data just doesn’t translate into real world fund results – the few, tiny, highly value-y stocks that accounted for the bulk of the Fama/French returns are too small and illiquid to be held in a consumer mutual fund.   

David and Rex didn’t produce the returns they promised investors. But they had a had a hell of a ride, and made a ton of money.  Sometimes they think about getting together and heading out for a night on the town. But they’re old now, in different states. They email. The other day Rex sent David his favorite quote from the ‘80s movie Risky Business, which he still has on Betamax:

It was great the way her mind worked. No guilt, no doubts, no fear. None of my specialties. Just the shameless pursuit of immediate gratification. What a capitalist.

Comparing Flagships – Understanding Almost 40 Years of DFA Underformance

 “there is a demonstrated phenomenon for small stocks as a group to outperform large stocks by roughly 5 percentage points a year in the last 50 years.”

DFA Founder Rex Sinquefield, in the Oct. 23rd, 1982 edition of the New York Times

In 1975, John C. Bogle founded mutual fund giant Vanguard. Its flagship product, now called the Vanguard 500 Fund (VFINX), was the world’s first consumer index fund. Its objective was simple – to capture the return of the S&P 500 index, less a small amount in fees.

In 1981, David Booth and Rex Sinquefield founded another mutual fund company, Dimensional Fund Advisors (DFA). DFA was based on another simple concept – that smaller stocks would outperform larger ones. Their flagship product, The DFA Small Cap Fund (DFSCX, later re-branded the “Micro Cap Portfolio”) was born.

Booth and Sinquefield’s idea made intuitive sense: smaller companies would probably be riskier than large ones, and that higher risk should be rewarded with higher returns. Small stocks also had “room to grow” and reward their investors with exponential price increases.

These theories were backed with empirical data – research had begun to show that small caps had in fact outperformed large caps over the preceding decades, with higher risk.

In some ways, Vanguard and DFA’s flagship funds were polar opposites – the 500 Fund held the largest 80% of the market, while DFAs Small Cap fund bet on the smallest 10% of stocks. They were, however, similar in that they eschewed stock picking, and attempted to passively track predefined segments of the market.

After almost 40 years, this post asks the question: “Which strategy should investors have followed?”

Let’s first look at risk. The DFA fund is unequivocally riskier that Vanguard’s. Compare the volatility of the two funds:

The standard deviation of the DFA fund is 24%, versus 17% for the Vanguard fund – an almost 50% difference. But did this increased risk translate into increased returns?

When looking at DFA results, the advisor fee customers pay must be considered, since you can’t own DFA funds directly. Here’s the 38.5-year growth of these two flagship funds, with and without a 1% DFA advisor fee. Source: Morningstar.

The Vanguard flagship grew at 11.4% per year, while the DFA flagship grew at 11.1%, or 10.1% after advisor fees. Vanguard investors wound up with at least an extra $115k on a $10k investment.

So, what happened? DFA investors got the higher risk they expected, just not the higher returns.

Part of the answer is cost. The DFA fund’s expense ratio is 0.5% higher than Vanguard’s. But ER isn’t the only fund cost. Trading small cap stocks, which tend to be illiquid and have higher bid/ask spreads, is more expensive than sticking with Bogle’s large cap strategy. And small cap funds must trade frequently, selling any stock that grows too large to meet its portfolio criteria. These expenses aren’t reflected in the ER, but they do reduce returns. They also make the fund tax inefficient.

This is why academic research tends to uncover small cap outperformance that investors are unlikely to see – that research fails to include advisor fees, or expense ratios, or transaction costs, or taxes.

Beyond cost, we might also revisit the assumption that small caps will outperform large caps significantly. Consider this chart of VFINX vs DFSCX prices since 1981 (Vanguard is red, DFA is blue):

Let me break it down for you.

Small and large caps had similar performance during the 1980s, with a slight edge to large caps. In the 1990s, as tech stocks like Cisco and Microsoft exploded, large caps outperformed. During the 2000s small caps clawed their way back, and by the 2009 Great Recession the two funds had identical long-term returns.

Small stocks were on track to handily outperform large during the 2010s…until 2019, when large caps caught up, and long-term performance was again identical. Small caps then proceeded to fall apart during the covid-19 crash of 2020.

Over the next 40 years, I expect small caps to slightly outperform large caps “on paper”, and underperform them in real world funds. The wise investor will hold both parts of the market – through a single, tax efficient total market index fund from Vanguard or similar.

Booth and Sinquefield’s experiment with small caps made them very rich men. Their customers, not so much. Bogle never made enough money have an elite business school renamed in his honor or take over a state. The fruits of his labor, as the chart above shows, went to Vanguard owners/customers. Consider carefully who you trust your life savings with.

Checking in on the Larry Portfolio

It sounded too good to be true. You could hold just 32% of your investments in a special group of stocks, keep the rest in risk-free government bonds, and earn the same return as other investors with 100% stock portfolios.

Or, so suggested an article in the Dec 23, 2011 New York Times. Written by Ron Lieber, it was titled “Taking a Chance on the Larry Portfolio”.

The Larry in question was Larry Swedroe, a noted financial author and advisor. And the Portfolio in question was a radical one. I’ll let Lieber explain:

As for the Larry Portfolio, which he prefers to refer to by more technical names, the only stocks it contains are mutual funds that hold small or value stocks (preferably both) from around the world. Everything else tends to go into very safe bonds.

In the article, and more specifically in other writings, Swedroe makes it clear that his preferred stock holding is a single investment, the DFA small value fund (Larry’s company sells DFA funds, which you have to go through an advisor to buy).

As small value stocks compose only about 5% of the stock market, this idea flies in the face of basic diversification principles. But Swedroe believed the risks were worth it – that small/value stocks offered such great returns that investors could cut back dramatically on the percentage of stocks they owned, and still get the returns of the market as a whole. This was based on historical data:

If you wanted to gin up a portfolio to match closely (at 9.8 percent) that [the S&P 500 index] performance with much less risk, all you would have needed to do was put 32 percent of your money in a fund mimicking the United States stock index of small and value companies that Mr. Fama and Mr. French developed. Then you’d put the other 68 percent of your money in one-year Treasury bills.

It’s been eight years since this article, so I decided to see how those who’d taken a chance on the Larry Portfolio had made out.

I built a Larry Portfolio, with a mix of 32% small value stocks, and 68% short term treasuries, then compared it to a 100% stock portfolio. For the small value stocks, I used DFSVX. For treasuries, I used the Vanguard Short Term Treasury fund, VFIRX. And for the stock market as a whole, I picked the Vanguard Total Stock market index fund, VTSAX, which closely follows the S&P 500 index mentioned in the article.

Here are the returns for the past eight years, and the final value of each:

image003

A $1,000 investment in the Vanguard market fund, which just tracks the US market as a whole, would have gained $1,973 between Dec 31, 2011 and Dec 31 2019. That same investment in the Larry Portfolio would have increased in value by $427. Even a 100% investment in that supposedly high returning DFA small value fund would have gained only $1,286.

Looked at another way, if you’d taken a chance on the Larry Portfolio in 2011 with your $300k retirement nest egg, here’s how much money you’d have at the end of 2019:

image005

So, what happened here? How did the Larry Portfolio go so horribly wrong?

One answer can be found by looking closely at the second quote above. When discussing the returns of the US market, the article uses the S&P 500 index as a proxy – an actual index with verifiable returns, involving many large, liquid stocks for which historical data is readily available.

But those incredible small value returns? They’re based on a dataset created by two academics, Eugene Fama and Ken French, both of whom have long been on the DFA payroll.

This data, sometimes compiled from old newspaper clippings, was often populated with a few tiny stocks too small and illiquid for mutual funds to hold. In other words, nobody ever got those incredible small value returns.

In the article, Lieber offers readers a prescient warning:

In fact, whenever something like the Larry Portfolio looks different from whatever the Dow or the Nasdaq are doing, there is sizable risk of regret.

I think it’s fair to say that in the case of the Larry Portfolio, like so many other free lunches promised by financial advisors, that regret risk was realized. There’s a lesson in there somewhere.


Disaster at DFA

For over five years, this website has warned readers to avoid DFA funds and invest in Vanguard instead. We’ve pointed out the relatively high fees, poor performance, high risk, lower diversification, and less tax efficient nature of DFA versus Vanguard.

Hopefully you were paying attention in 2018, and dumped your DFA holdings before 2019 began – because failing to switch would have cost you a large amount of money.

Let’s look at the results for 2019. We’ll compare three funds:

Fund Symbol Strategy
Vanguard Total US Market VTSAX Total US stock market, market cap weighted.
DFA Vector Equity DFVEX Total US stock market, small/value weighted.
DFA Small Value DFSVX Small/value stocks only.

And here are the 2019 results:

Capturedfa14

The Vanguard fund rose 30.4% in 2019, the Vector Equity fund 25.7%, and the small value fund 17.8%. (this site measures returns through Dec 30, since that’s the date DFA’s Vector Equity and other total US stock market funds were created). Looked at another way, here are the gains on a $500k investment in each fund in 2019:

image003

That’s a stunning difference when you consider all three funds track the same asset class (stocks) in the same country. This, year, I’ve given DFA a break and not tacked on the 1% fee most investors have to pay their friendly DFA advisors for the privilege of owning these “elite” funds.

Note that the DFA Small Value fund isn’t directly comparable to the Vanguard fund, since it doesn’t cover the entire stock market. But DFVEX, which is a total US Stock market fund, is.

Critics will note that this is just one year – too short a period to draw any conclusions about the superiority of one fund versus another.  And so, once again, let’s show the complete, 14 year history of Vanguard vs DFA, since the DFA fund’s inception in 2005:

dfa14

Vanguard’s experienced 248.2% growth, versus 187.8% for DFA. Happy birthday, DFVEX. Here’s how that looks in dollar terms (once again I’ve assumed no DFA advisor fee):

image007

To be clear, the Vanguard fund simply represents all stocks in the US market, weighted by the size of each company. Investors pay DFA to outperform that passive index.

Once again this year, DFA company owners and their network of salespeople made a lot of money. And, once again, DFA investors underperformed.

A new year is upon us. Which company will you choose in 2020?


Judging DFA’s “value” marketing angle with 20 years of real world data

Since 1993, the cornerstone of DFA’s marketing strategy has been that “small” and “value” stocks offer superior returns for investors. This was based on historical data compiled by two academics, Eugene Fama and Kenneth French, who were soon on the DFA payroll.

The Fama/French data showed not only that value stocks outperformed growth, but that small growth stocks were especially bad. As DFA advisor William J. Bernstein wrote in 2002:

But the larger point is simply not to buy small growth funds at all—this is a miserable asset class, with long-term historical returns lower than all other market segments.

DFA advisors such as Larry Swedroe, and others made similar claims, with Swedroe declaring small growth stocks the Black Hole of Investing. Ouch.

There was just one problem: the Fama/French data had little relationship to real world mutual funds. Much of its supposed “small value premium” came from a few, tiny, illiquid stocks that no mutual fund could own. It also assumed holdings could be bought and sold with no transaction costs, which only happens in academic papers and marketing brochures.

Could the “small value premium” be realized in reality? And was avoiding small growth stocks a valid strategy?

In 1998, Vanguard decided to find out. It launched two index funds: one Small Growth (VISGX), one Small Value (VISVX). These were the first small value and growth index funds.

We now have 20 years of data from each of these products. We’ve been able to track them through two economic cycles, including the recessions of 2002 and 2009. The results (total return, source: Morningstar):

visvx_visgx2

After 20 years, Vanguard’s Small Value fund returned 488%, versus 572% for Small Growth. Not exactly the “black hole” the DFA data predicted.

DFA advisors continue to market based on Fama/French data, as if these questionable historical results have any real world significance. If the data above isn’t enough to discredit it, I don’t know what is.

DFA: 13 Years of Underperformance

Birthday wishes are in order for Dimensional Fund Advisors’ all-in-one “Core Equity” mutual funds, which recently turned 13.  It’s an awkward age, filled with heartaches and insecurity. How popular am I? Where do I fit in?

These underperforming youths, alas, are unlikely to ever date cheerleaders or find themselves voted Most Likely To Succeed.

A quick recap: Until 2005, DFA offered an ever-expanding hodge-podge of funds that covered only slices of the stock market. They started with small cap funds in 1981, and, when those underperformed, switched to so called “three factor” portfolios (overweighting small and value stocks) in the 1990s.

This revolving lineup of products made for great marketing – if a fund covering one bit of the market outperformed, as random chance would dictate, DFA highlighted those with customers, ignoring the laggards. Or they simply started new funds, making trails of poor performance disappear.

In 2005, however, DFA began offering a lineup of “Core Equity” funds that covered the entire market. Sales brochures from the time sold them as:

The result of decades of experience, integrated portfolios that deliver broad diversification and low-friction factor exposures—the synthesis of Dimensional’s investment philosophy.

Since these funds were meant to be the only US stock fund an investor needed, it was finally possible to compare a single DFA product to the simple total market index fund a Vanguard investor would make.

The three funds they created are detailed below:

Fund Symbol Strategy
DFA US Core Equity 1 DFEOX Modest small/value concentrations
DFA US Core Equity 2 DFQTX Greater tilt toward small and value stocks
DFA US Vector Equity DFVEX Heavy DFA magic

This blog has focused on DFVEX, which, if DFA really does have a market beating formula, would show the greatest evidence of outperformance.

Here are the results 13 years on. This chart from Morningstar shows the value today of $10,000 invested in both Vanguard’s Total US Market fund (VTSAX), and the DFA Vector fund (DFVEX), on Dec. 30, 2005, the day the DFA fund was incepted:

DFVEXat13

Here’s a closeup of the results from the upper left corner of the chart:

DFVEXClose

Over 13 years, the DFA Vector fund returned 6.5% per year, annualized. Meanwhile, VTSAX returned 7.7% per year.

Let’s put that 1.2% difference into perspective. Here’s what a $300,000 investment in each fund 13 years ago would be worth today:

Fund Value
DFVEX $681,300
VTSAX $790,230

That’s a loss of $108,930 versus simply holding the market as a whole. Some people call that real money.

But it gets worse: DFA funds aren’t available to purchase directly. Investors must go through financial advisors and pay an additional annual fee for the privilege of the performance above (some people can own them directly through a 401k).

Deducting the standard 1% annual advisory fee, the $300,000 investment above is is now worth only $601,773 – an almost $200,000 drop from what a simple Vanguard fund returned.

Will these ungainly teen-aged funds grow into captains of the football team? Don’t count on it. Global financial markets are far too efficient to allow easy-to-spot free lunches in “factor portfolios”. As we’ve been saying and showing here since 2014, the smart money sticks with Vanguard.

DFA Falls Further Behind

It’s been 18 months since this blog documented the greater risk, higher fees, and middling performance of DFA funds versus Vanguard, and it’s time to update our results. I’d hoped to do so after one year, but time did not allow. Please read this post to understand DFA’s strategy, and the reason we’re using DFA’s Vector Equity fund for our comparison.

18 Months Later

Below is the total return (price increase plus reinvested dividends) of the DFA Vector Portfolio fund (DFVEX, blue line) versus the Vanguard Total Stock Market fund (VTSAX, orange line), which simply tracks the market as a whole:


ScreenHunter_47 Jul. 03 16.06.jpg


Here’s a close-up of the upper left hand corner:

ScreenHunter_50 Jul. 03 16.08.jpg

While DFA has underperformed Vanguard for many years, this trend seems to have accelerated recently.

Over the last 10.5 years, Vanguard has outperformed DFA by .9% per year, and that’s before DFA adviser fees and sales commissions.

As well as higher cost and under-performance, it’s important to note the greater risk those who concentrate their stock holdings in small and value stocks assume. Note the sharper loss of the DFA fund versus the Vanguard fund during the crisis of 2008-09.

After an abysmal first 15 years (1981 was a bad year to launch a small stock fund), DFA had a few years of out-performance during the Clinton administration. DFA advisers continue to market this brief period – when DFA was a tiny fund company – as if it persists to this day. The results above, however, tell a very different tale.

DFA captures a slice of less sophisticated customers who believe there really is a free lunch lurking somewhere in “factor” portfolios, though they’re not sure where, or why. In reality, markets behave rationally and move randomly, and cost and diversification should be the focus of investors.

Do More “Concentrated” DFA Portfolios Outperform?

As discussed here, Dimensional Fund Advisors (DFA) uses a variety of strategies to attempt to outperform the market. In its early years, it offered a only a collection of fragmented and sometimes overlapping funds designed to capture different bits of the US stock market. This made it hard for advisors to manage client accounts, and tough for observers to track the performance of DFA portfolios as a whole.

In 2005, DFA solved this problem by creating a series of all in-in-one investments which sought to capture their entire strategy in a single investment. No more would clients have to continually rebalance among individual funds, possibly incurring capital gains taxes.

Three funds were created, with varying degrees of “DFA magic”, or concentrations in the small and value stocks DFA felt would beat the market as a whole. Allow me introduce them:

Fund Symbol Strategy
DFA US Core Equity 1 DFEOX Modest small/value concentrations
DFA US Core Equity 2 DFQTX Greater tilt toward small and value stocks
DFA US Vector Equity DFVEX Heavy DFA magic

The Core 1 and 2 funds were launched September 15, 2005, with Vector being released three months later. For more on these products, and DFA equity strategies generally, see the DFA website.

To get an idea of the differences in these funds, consider the average size of the companies held in each fund, as calculated by Morningstar, and compared to the Vanguard Total Stock Market fund:

image001

As you can see, the market cap of the average stock in the DFA Vector fund is just 1/6 of the Vanguard Total Market fund. Note that this is a simple, not a weighted average.

Let’s now look at how these funds have performed over the past decade, and infer how much DFA magic, if any, we ought to include in our own portfolios.

Core 1: DFA Light

As DFA planned, DFEOX isn’t hugely different from the total stock market as a whole – in fact, of its 25 size and value fund categories, Morningstar puts both it and the Vanguard Total Stock Market fund (VTSAX) in the same “Large Blend” box. The chart below, also from Morningstar, shows the daily growth of these two funds (updated in 2019). The blue line is DFA, the red line is Vanguard.

DFEOXvsVTSAX

The Vanguard Total Market and DFA Core 1 portfolio histories are almost indistinguishable. After 14 years, a $10,000 investment in VTSAX was worth $34,070, while the same amount grew to $33,119 in the Core I fund. This DFA fund only underperformed Vanguard by 10% over the period.

Core 2: Medium Strength Magic

Did DFQTX, with its smaller and more value-y profile, give investors something better, or an least different? Let’s look:

DFQTXvsVTSAX

As we’d expect, DFA’s middle child (blue) shows a bit more variation from the total US stock market (red). They’re still pretty highly correlated though, which isn’t to surprising since stock prices in a particular country tend to move together. Since Core 2’s inception, a $10,000 investment is worth $31,253, about $2,817 less than Vanguard, once again before advisor fees in the case of DFA.

Vector: Hard “Core” DFA

This brings us to DFVEX, the least broadly diversified of the three. By making large bets on very small and value-y stocks, it invests customer funds on a relatively small portion of US economic output. How does it stack up?

DFVEXvsVTSAX

Now we’re starting to see some real variation from the market as a whole. The Vector fund also had the weakest performance of the three. A $10,000 investment in each would have underperformed a whopping $5,415 since the inception of the DFA fund in 2005. Vanguard outperformed DFA, cumulatively, by 54%!

Conclusion

The greater diversification of the Vanguard Total Stock Market fund, and its slightly lower cost, allowed it to offer better returns than the three DFA funds. Add in advisor fees investors must pay for DFA access and the difference is of course much greater.

Going forward, each of these funds will, by definition, perform only as well as the stocks they hold, less fees. Future stock performance is unknowable, so its entirely possible that, for example, the Vector fund will roar ahead in the coming years. The compounding drag of the higher fees of the DFA funds, however, makes this unlikely over the long term, especially on a risk adjusted basis.

Vanguard vs DFA

Investors commonly find themselves considering both Vanguard and Dimensional Fund Advisors (DFA) mutual funds. These two popular companies offer broadly diversified investments that shy away from active stock picking.

But there are a few differences between the two. For one, DFA is a for-profit corporation, while Vanguard operates at cost and exists solely for the benefit of its customers. For another, Vanguard funds can be purchased directly by investors, while DFA funds are only available through financial advisors.
They also have somewhat different investment approaches.

Vanguard investors typically follow a strategy of buying and holding the entire stock market at the lowest possible cost. “It’s impossible to outperform the market consistently,” this philosophy goes, “so we’ll just try to capture the full return of it.” While Vanguard does offer active and other non-total market funds, its largest funds, and the ones it chooses to include in its Target retirement portfolios, reflect this total market philosophy.

DFA, while also subscribing to the low cost passive model, employs a number of strategies it claims will produce better results for shareholders than simple indexing. These include:

  • Favoring smaller companies.
  • Favoring so called “value stocks”, defined by DFA as those with higher than average book values per share.
  • Favoring “momentum” strategies, which hold stocks that have done well in the recent past.
  • “Patient trading” – buying and selling stocks strategically instead of blindly following an index to manage costs and allow for less liquid holdings.
  • Retaining broad diversification by holding less of, but still owning, stocks not meeting these criteria, such as large and growth stocks.

So, does the DFA approach give them an edge over simple indexing? In the past, it was hard to tell. DFA advisors would invest customer money in a number of its 28 funds, each capturing different bits of their strategy. It was difficult to determine, from its scattered (and often overlapping) individual funds, how a DFA portfolio as a whole might perform.

Almost a decade ago, however, DFA launched a product incorporating its entire philosophy into a single investment. On December 30, 2005, the DFA US Vector Equity Portfolio (DFVEX) was born. No longer would DFA advisors have to buy a large number of funds and rebalance among them, possibly incurring capital gains taxes along the way. The Vector fund was all you needed.

We now have 9 years of real world data on this investment. This is also recent data, a fact especially important in the case of DFA, which was a tiny fund family for most of its 30 year existence. Even a decade ago, it was only about 10% the size it is now. Since many of its strategies (such as buying smaller and less liquid stocks) become harder to execute as fund size grows, data from the distant past may not be relevant today. An example of these growing pains may be seen in the rebranding of its original fund, DFSCX, from “small cap” to “micro cap”, and creating new “small cap” funds holding larger stocks.

To be clear, DFVEX covers only the US stock market. Vanguard investors have a similar all-in-one US stock investment, the Vanguard Total Stock Market fund, VTSAX. Unlike the many active strategies DFA uses, VTSAX holds stocks purely based on their size, or market cap. The bigger the stock, the more it holds. VTSAX employs no sophisticated market beating strategies. It just sits there.

Now, on to the comparisons.

Performance

Let’s get the big one out of the way. Which fund has done better for shareholders? (Data updated in 2019)

DFVEXvsVTSAX

As we’d expect, these funds have had very similar returns, since they both broadly cover the US stock market. In this chart from Morningstar, we see that a $10,000 investment in each fund since DFVEX’s inception resulted in a gain of $17,923 for DFA, and $23,338 for Vanguard.

Of course, that excludes the advisor fee investors using DFA advisors must pay. Here’s the growth of a $300k initial investment, with and without a 1% advisor fee:

image006

That’s a stunning difference in results.

Winner: Vanguard – by 1.4% per year, or 2.4% with advisor fees.


Cost

Vanguard’s performance advantage is due in small part to its lower cost. For the pleasure of underperforming the market, DFA charges exactly 8 times the annual expense ratio of Vanguard – .04% for VTSAX versus .32% for DFVEX. With a 1% advisor fee you’re looking at not 8 times, but 33 times the annual cost of the Vanguard fund. Here’ how these costs add up with that $300k investment, over 14 years:

image009

Those are terrifying numbers. The additional expense of the DFA option compounds dramatically over time.

Winner: Vanguard by a landslide


Risk

When comparing investments, risk must always be considered. High risk stocks, for example, have had greater returns than low risk government bonds historically, but we can’t simply declare stocks the better option, since they were also so much riskier.

DFVEX and VTSAX should have similar risk, since they’re composed of mostly the same US stocks. However, the DFA fund holds out-sized amounts of more risky parts of the market (mainly small caps). It’s also arguably less economically diversified, as it makes relatively large bets on stocks the market has assigned smaller values to.

One way to measure risk is to simply look at volatility – how much the price of the fund varies from day to day. As of November 2019, per Morning star the 10 year volatility of DFVEX is 15.9% versus 12.9% for Vanguard. The DFA fund is clearly riskier.

In the real world, this means your DFA fund is likely to fall further during the next market crash. The 2008-09 financial crisis and recession is a perfect example of this. Let’s look at how both funds behaved:

DFVEXvsVTSAXRisk

The graphic above shows that the Vanguard fund dropped 18% during the crisis, while the DFA fund dropped by 24%.  DFVEX was the riskier of the two investments.

Winner: Vanguard, any way you slice it


Conclusion

It’s important to note that we’re not just comparing DFA to Vanguard. VTSAX represents the US stock market itself. The real question is, then: do DFA’s strategies have any value at all? It appears from the data that the answer is no.

To be the superior investment going forward, DFVEX will not only have to outperform in absolute terms, but on a risk adjusted basis as well. Given its cost and the historical data so far, the odds of such as feat are greater than zero, but not much greater. Since DFVEX is representative of a typical DFA advisor portfolio (or at least the US stock portion of it), I believe most DFA clients should expect similar results.